Jul 11, 2020

Brasil - Dívida Pública Bruta / PIB

Brasil - Dívida Pública Bruta / PIB

Em maio de 2020, a dívida pública brasileira consolidada, isto é, com a inclusão da dívida dos Estados e Municípios atingiu R$ 5,9 trilhões, equivalente a 82% do PIB. Desse total, R$ 5,2 bi se referem à a dívida interna, e R$ 730 milhões é o valor da dívida externa.

Conforme podemos verificar no gráfico, a dívida pública sobre o PIB representava 76% do PIB em dezembro de 2019. O crescimento de 6% do PIB equivale a um aumento de quase R$ 400 bilhões na dívida pública.


Gross Debt to GDP Ratio
Fonte: Banco Central do Brasil

Jul 3, 2020

Brasil - Balança Comercial em Maio / 2020


Brasil - Balança Comercial em Maio / 2020

O saldo da balança comercial atingiu US$ 7,4 bilhões no mês de junho. Esse foi o maior saldo comercial para o mês de maio da história, e o 2º maior saldo de toda a série histórica. Apesar do valor positivo, esse número só foi possível após queda brusca das importações, que caíram cerca de 20% em relação ao mesmo mês do ano passado.

O gráfico a seguir mostra a evolução recente do saldo da balança comercial no Brasil. 

Oct 23, 2016

Brazil: Expenses with Interest Payments of the Public Sector

Brazil: Expenses with Interest Payments of the Public Sector 


The real interest rates in Brazil have always been among the highest in the world, and this is reflected in government disbursements for the payment of public debt costs.
As we can see in the chart, government spending with the payment of debt interest fluctuated in today's values between BRL 250 and BRL 350 billion between 2014 and 2014, and accelerated from the end of 2014, with a peak close to BRL 600 billion in early 2016, and then was reduced for BRL 435 billion in August 2016.


Brazil_interest_expenses
Source: Central Bank of Brazil


The acceleration of interest expense coincides with the increase in public debt (see post here).


The prospect is that real interest rates in Brazil will fall, as has occurred in major economies of the world. A lower rate of interest should reduce the need for government to pay interest in the medium term, but in the short term, the costs must also reflect the high interest rates of the current stock of government securities.

Oct 16, 2016

Brazil: Exports of Commodities


Brazil: Exports of Commodities

The fall in commodity prices, which began in 2012, and was stronger in the second half of 2014, had a significant impact on the value of exports of Brazilian commodities.
Exports of primary products reached the value of USD 124 billion in annualized values ​​in April 2012 and currently stand at USD 80 billion in the last 12 months.

The fall in commodity prices can be explained by the slowdown in global growth, especially in China, which is the largest importer of Brazilian products. In addition to slowing production, we can also cite as causes excessive investment and increased capacity above the demand growth in various products, including, iron ore, which has been the main product of Brazilian export basket.


Figure 1 attached shows the value of Brazilian exports of basic products accumulated in the last 12 months. As we can see, growth was slow between 1990 and 2002, and accelerated between 2003 and 2012, except for 2009. As of 2012, exports began to slow down until the last data available, which is September 2016. There is a not currently significant change in global growth prospects, especially in China, although the volume of investments in commodities decelerated significantly in some sectors. It is unlikely that the exported value returns to 2002 levels, but growth from the current level are also limited.

Source: www.mdic.gov.br

Sep 18, 2016

Brazil - Public Expenditure Growth


Brazil - Public Expenditure  Growth

The chart below shows the growth rate above inflation of federal government spending, calculated by the sum of 12 months divided by 12 months immediately prior. It does not include the expenses of the states and municipalities.

The average rate of growth of public spending was approximately 5% above inflation between 1998 and 2016. The Social Security benefits spending grew about 6% above inflation over the same period.

The expenditure growth was only possible because there was also growth in revenues in the period, related to the expansion of GDP and rising international commodity prices.

However, from 2014, expenses kept the growth trend, while the stagnation of the economy has reduced expenditure growth, resulting in the rise in public debt.


Note that the Social Security benefits have structural feature, and the trend is growing maintenance above inflation, considering the current rules. Benefits of Social Security is now the equivalent of about 40% of total expenditure, and the trend is of explosive growth without reform of its rules.


Brazil - Expenses of Public Sector
Source: Brazilian Treasury

Sep 11, 2016

Brazil - Gross Debt to GDP


Brazil - Gross Debt to GDP

Consolidated gross public debt reached 69.5% of GDP in July 2016. In early 2014, it was around 52%.

This rapid growth was caused by the rise in the fiscal deficit, due to rise in government spending above inflation, and also the high level of interest rates, which led to overspending with the payment of debt service.

There was also a reduction in tax revenues due to the economic recession. Regarding the recession, beyond the cyclical component that has been the decline in international commodity prices, there was also a decline in general levels of confidence caused by the political crisis.

The perspective to ratio gross debt / GDP ratio will continue to grow in the coming years. The adjustment that the government is proposing should not be enough to stabilize the debt growth over the next 3 or 4 years.

The graph shows the recent evolution of the gross debt to GDP in Brazil.


Source: Central Bank of Brazil

Jan 25, 2016

Gasto de Brasileiros com Turismo no Exterior

GASTOS DE BRASILEIROS COM TURISMO NO EXTERIOR

Os gastos dos brasileiros no exterior apenas com viagens de turismo atingiram USD 13,3 bi nos últimos 12 meses finalizados em novembro de 2015, com queda de 27% quando comparado aos 12 meses imediatamente anteriores. Os dados podem ser encontrados no site de séries temporais do Banco Central, com a série de número 22757. Este dado exclui os outros gastos com viagens no exterior (como estudos, tratamento médico, etc.)

No entanto, quando convertido em reais, esta queda não parece ter sido tão intensa. Utilizando-se a cotação do dólar médio de cada mês para calcular o valor em reais, podemos verificar que os gastos dos brasileiros no exterior caíram apenas 1,2% em termos nominais na mesma base de comparação, com pico de crescimento de 33,4% em setembro de 2013.

Os dados estão no gráfico a seguir:

Gastos dos Brasileiros


Como podemos ver no gráfico, aparentemente, a elevação da cotação do dólar apenas fez com que o crescimento dos gastos em moeda local parasse de crescer em termos nominais. 

Em resumo, os brasileiros praticamente não reduziram seus gastos com viagens de turismo em reais.


Jan 6, 2015

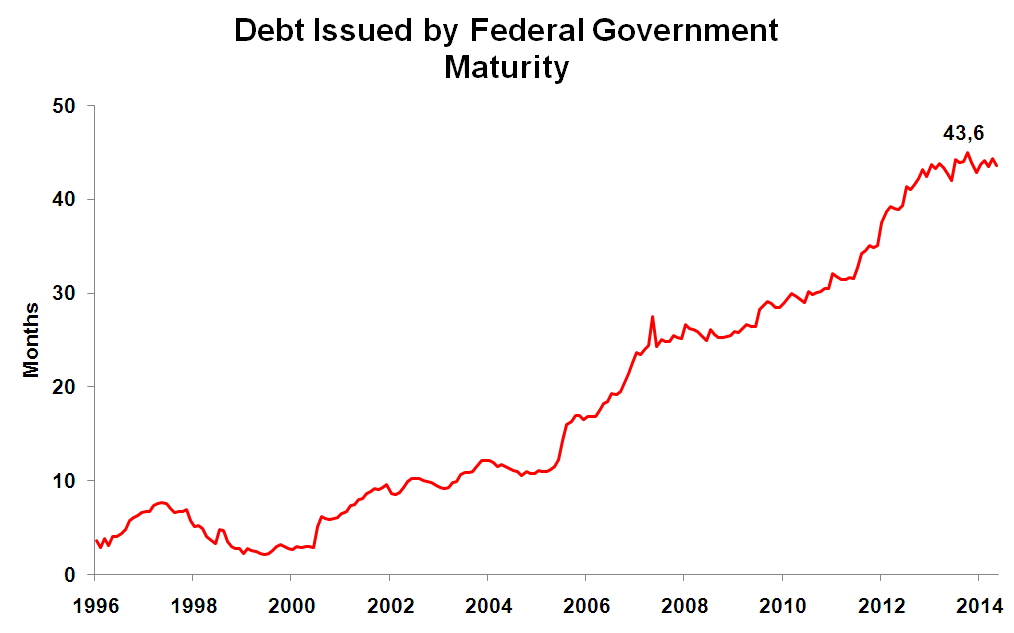
Brazil - Maturity of Federal Debt

The maturity of the federal public debt was 43,6 months in November.2014. In the same month of the year before, it was 42.8.2 months. 

The chart below shows the evolution of the maturity of federal debt in recent period.


Maturity of debt issued by Brazilian Federal Government
Source: Central Bank of Brazil


Jan 5, 2015

Brazil: Trade Balance

The trade balance had a USD 3.9 billion deficit in 2014. The main reason for this deficit was the fall in export commodity prices, such as iron ore nd soybeans.Brazilian exports totaled USD 225.1 billion and imports USD 229 billion in 2014.


The chart below presents the recent evolution of the Brazilian trade balance.

Brazilian Trade Balance in 2014
Source: Ministry of Industry and Development

Dec 9, 2013

Brazil Public Sector: Borrowing Requirements

The nominal deficit of the consolidated public sector reached 3.45% of the GDP in the last 12 months ended in October/2013. As the graph shows, the nominal result reached its lower level in mid-2008, and has a growth trend since 2011. This deterioration in nominal result was due mainly to low pace of economic activity, which led to a lower growth of public revenues. On the other hand, expenditure continued with a pace of real growth, contributing to worse the public accounts.


Source: Central Bank of Brazil 


See also:
http://www.brazil-monitor.com/2013/11/brazil-gross-public-debt.html

Dec 8, 2013

Brazil - International Reserves

The volume of international reserves reached USD 361 million at December 05, a decrease of USD 12 billion compared to the end of 2012, according to data released by the Central Bank of Brazil. The growth in the volume of reserves, as we can see in the chart, has occurred consistently over the past 10 years. The slight decrease in the volume of reserves in 2013 was due to the sale with repurchase agreement the Bank have been practicing to increase the  liquidity to the foreign exchange market, and the volume of reserves should rise as soon as these operations goes to maturity.


Source: Central Bank of Brazil


Dec 1, 2013

Brazil: Labor Force

According to the IBGE - Brazilian Institute of Geography and Statistics, the "PIA" (active age population) reached 42.9 million people in October 2013 in the metropolitan areas in Brazil, virtually equal to the previous month and an increase of 1.2% compared to October 2012. In 2013, the average growth was 1%.


The graph below shows the evolution of the labor force and the growth rate over the previous year and in the last 12 months. The graph shows that the size of the labor force increased 1.1% over the last 12 months, but this growth has been in a declining trend over the past 10 years.


Source: www.ibge.gov.br

Nov 24, 2013

Brazil - Balance of Payments - Oct/2013

The balance of payments registered a deficit of USD 4.5 billion in October. The current account deficit reached USD 7.1 billion in the month and $ 67.5 billion in the year through October, more than in the same period 2012, USD 39.6 billion. In the last twelve months, the accumulated current account deficit of $ 82.2 billion, equivalent to 3.67% of GDP.


The net balance of Brazilian direct investment abroad and foreign investment in Brazil reached USD 5.5 billion in October

Foreign portfolio investment showed net inflows of $ 388 million in October and totaled USD 41 billion in the last 12 months.

The chart below shows the historical data of Brazil's balance of payments:

Source: Central Bank o Brazil


The complete tables, published by the Central Bank of Brazil, are in link:


Nov 17, 2013

Brazil - Inflation Oct-2013


The official inflation index reached 0.57% in October, and in the last 12 months, accumulates 5.84%, and it is with a slight downward trend, as we can see in the chart below.
By decomposing the ratio between monitored and non-monitored prices, we can see that, while non-monitored prices rose 7.4% in the last 12 months, monitored prices rose only 1%. Monitored prices are mostly prices of electricity power, fuel and bus fares, and are sectors where the government intervened to prevent price increases to curb inflation.

More details can be found at:

http://migre.me/gFcgH


Nov 3, 2013

Brazil: Gross Public Debt

The Brazilian gross public debt totaled BRL 2.8 trillion in September (in USD, about 1.3 trillion), and reached a level of 58.8% of GDP. The domestic and external gross debt achieved respectively 55.8% and 3% of GDP. The debt, mesuared as percentual of  GDP, had a slight decrease compared to the month before, when it reached 59.15%, and is virtually the same level of September of 2012, when it was 57.8%.


The chart below shows the recent evolution of gross debt to GDP.


Source: Central Bank of Brazil

Oct 27, 2013

Brazil - Real Wage

IBGE - Brazilian Institute of Geography and Statistics - reported the average wages that prevailed in the labor market in the country's six largest cities: Sao Paulo. Rio de Janeiro, Belo Horizonte, Porto Alegre, Recife and Salvador. According to these data, the average salary in September 2013 was BRL1,900.14, equivalent to USD 867 per month. Over the past 12 months, real average salary was USD 10,575  in annual basis. In the last 9 years, , the average annual growth in real wages measured in constant USD was 3.2% a.a.

Source: IBGE

Oct 21, 2013

Brazil - Current Acount - Aug 2013

Brazil had a current account deficit in August which  represented 3,6% of GDP. The chart below shows the evolution of current account balance to GDP in a recent period.


Graph I - Current Account % of GDP - Last 12 months.


Oct 20, 2013

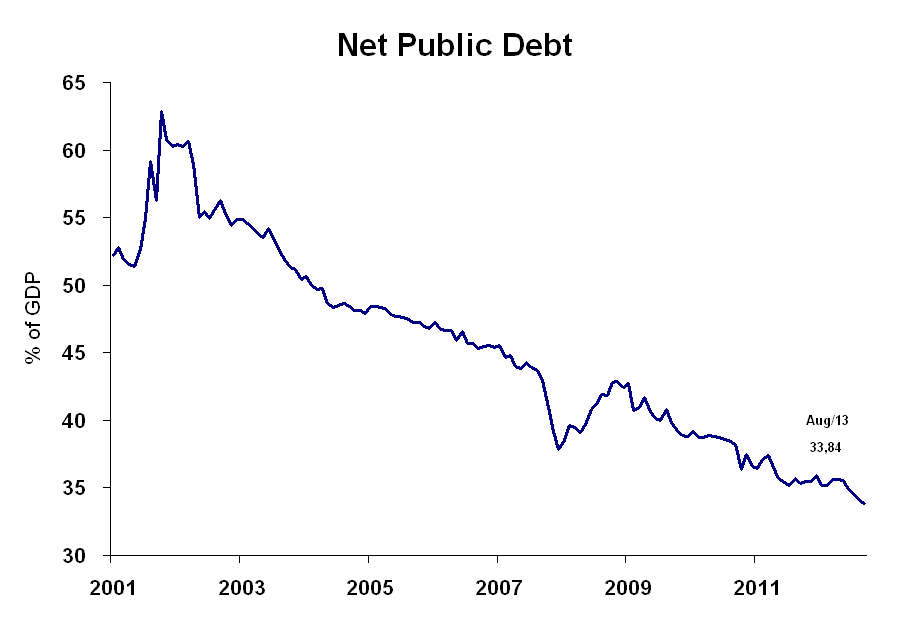
Brazil - Net Public Debt Aug-2013


The ratio net public debt to GDP reached 33,84 % in August 2013 and come in a downward trend over the last decade, as we can see in the graphic below. The Brazilian government is a creditor in foreign currency, and the movements of BRL depreciation leads to debt reduction, as occurred in 2008 and the start of the 2nd half of 2013.


Brazil Economic Monitor will be back soon !

Jan 6, 2012

Brazil: Inflation in 2011

The inflation rate measured by the IPCA reached 6.5% in 2011, with a high compared to the previous year, when it reached 5.9%, as we can see in the chart below.

Several factors explain the rise in the index. Among them, we can mention the increase in international commodity prices and the pressure of the strong level of activity, especially in services prices.

We can divide the policy to combat inflation in two stages. In the first semester, the Central Bank raised interest rates and also took several macro-prudential measures aimed at restricting domestic demand through the credit crunch. These measures had no effect, and the inflation rate continued to rise, and peaked at 7.30% during the year.

In the second semester, the pressure of commodity prices had eased and there were signs that the level of activity was at a very low pace. In this scenario, the Central Bank initiated a fall in the Selic rate. However, this fall in the Selic rate was not enough for the resumption of economic activity, but the 12-month inflation eased somewhat, closing the year at 6.5%.

For the year 2012, inflation control is uncertain. Market forecasts show inflation around 5.5%, but the level of economic activity is very low and interest rates are still on the decline. The great challenge for policymakers is to reconcile the interest rates to economic growth without to fuel the inflation.

Source: IBGE